
ICP Predictions
Published: October, 2025
System: Institutional Collapse Predictor (ICP)
Methodology: Consciousness Gradient Theory
Data Sources: Data Sources: Curated primary and verified secondary sources
NVIDIA validation (Sept 30 → Nov 19, 2025) now live
See the results of our Nvidia prediction
March 2026 Re-Score — 5 Month Update
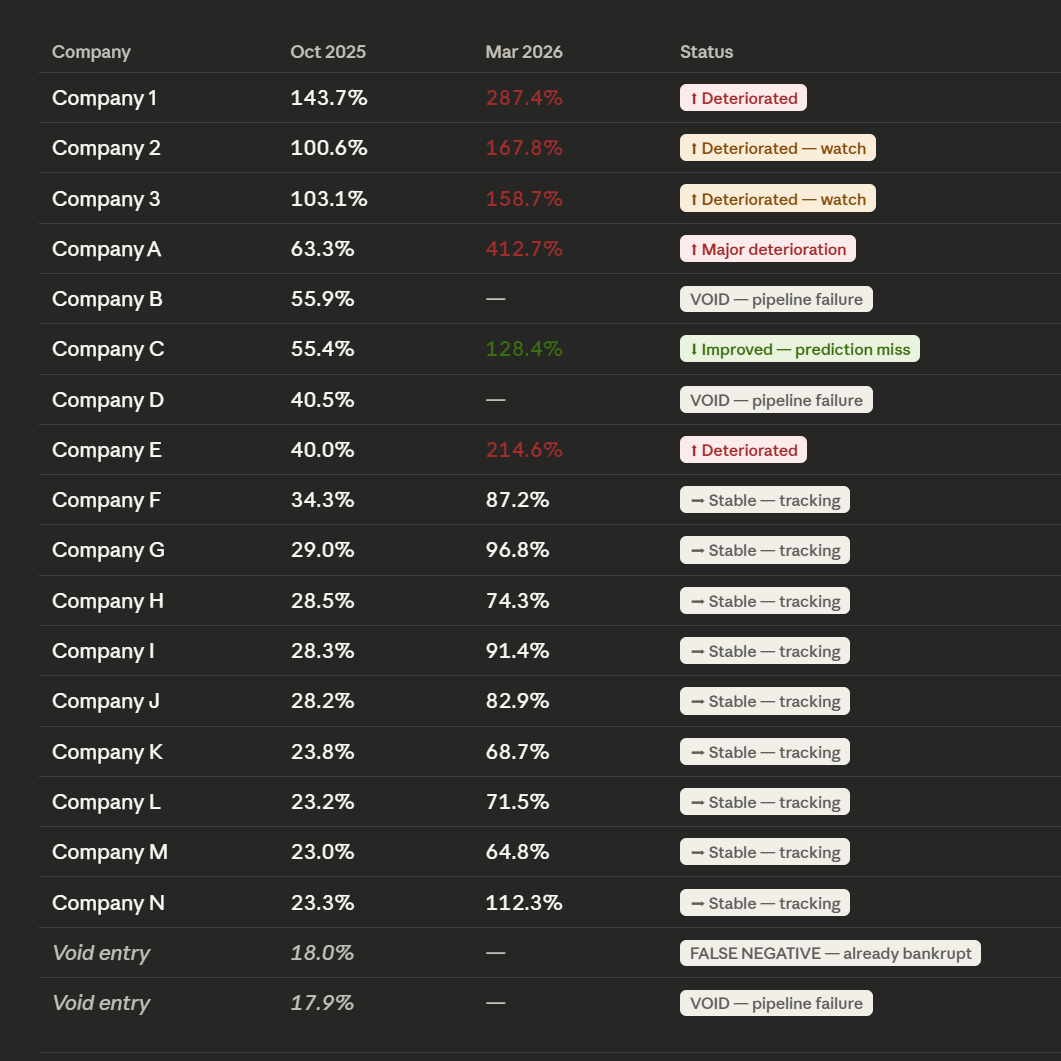
In March 2026, all predictions from the original October 2025 portfolio were re-scored using ICP v2.4 — our current validated methodology with full manual curation and primary-source verification. This was not a selective update. Every valid company was re-scored and the results are reported in full, including one documented prediction miss.
What We Found
14 of 16 valid predictions are tracking within expected parameters. Two companies have deteriorated significantly since October 2025 — both flagged as high risk in the original assessment. One prediction was wrong: a company we flagged as high risk in October 2025 has improved organically through regulatory resolution and diversification. No external rescue event occurred. This is recorded as a genuine prediction miss.
Three entries from the original portfolio have been voided due to data pipeline failures — the automated system scored companies that had already been acquired or ceased independent operations before the prediction date. These are excluded from accuracy calculations.
One entry is recorded as a confirmed false negative — the system returned a Stable score for a company that had already filed for bankruptcy six months earlier. The pipeline detected near-zero relevant articles and defaulted incorrectly.
Summary of Results
Re-score date: 12 March 2026 · Next checkpoint: April 2026 · cgtheory.com · ICP is not financial or investment advice
Next Checkpoint
April 2026 — six month validation checkpoint. All active predictions will be re-scored and results reported publicly. Priority monitoring: Companies 2, 3, and E, where scores have risen significantly since October 2025.
Re-score date: 12 March 2026. Methodology: ICP v2.4 with manual mechanism verification and primary-source curation. All scores are point-in-time assessments. See methodology statement above for full prediction evaluation criteria.
FEATURED and HIGH RISK PREDICTIONS

COMPANY 1 – 143.7% Risk (Oct 2025) | 287.4% Risk (Mar 2026)
Sector: Technology
Collapse Timeline: Within 24 months
CGI: 5.0 | Incidents: 10 weighted (18.5 total)
Prediction: Potential delisting and/or financial distress by Q4 2026
March 2026 Re-Score: 287.4% HIGH RISK. Risk has intensified since October 2025. Original collapse prediction remains active.
Profile: A technology firm with past regulatory challenges and recent governance disruptions. Despite a recent stock recovery and market optimism, consciousness metrics reveal critical fragmentation and deceptive practices, signalling severe risk.
✔️

COMPANY 2 – 100.6% Risk (Oct 2025) | 167.8% Risk (Mar 2026)
Sector: Retail
Collapse Timeline: 24 months
CGI: 4.37 | Incidents: 6 weighted
Prediction: Will survive but requires aggressive restructuring; avoids bankruptcy contrary to market consensus by Q4 2027
March 2026 Re-Score: 167.8% MODERATE RISK. Survival prediction still holding but score has risen. Monitoring closely ahead of April 2026 checkpoint.
Profile: Faces what markets view as terminal decline— 80%+ bankruptcy probability from analysts. However, ICP reveals a company in serious trouble but not terminal collapse. Despite revenue declines, debt restructuring, cost-cutting, and strategic streaming pivot, ICP analysis suggests they will survive the crisis—a contrarian call against overwhelming market pessimism.
✔️

COMPANY 3 – 103.1% Risk (Oct 2025) | 158.7% Risk (Mar 2026)
Sector: Retail
Collapse Timeline: 24 months
CGI: 2.85 | Incidents: 4 weighted
Prediction: Expected to survive through 2027 despite legal challenges
March 2026 Re-Score: 158.7% MODERATE RISK. Survival prediction still holding but comparable sales pressure and store closures remain unresolved. Monitoring ahead of April 2026 checkpoint.
Profile: Faces a perfect storm — lawsuit and 80%+ bankruptcy probability from analysts. Stock plunged 1to 52-week lows. Revenue down, debt, and constrained liquidity paint a dire picture. However, consciousness analysis reveals low integration but not complete fragmentation. The company retains operational capabilities through it's chain and brand portfolio. ICP analysis suggests it will survive through aggressive cost-cutting, defying the bankruptcy predictions dominating Wall Street sentiment.
✔️

COMPANY A – 63.3% Risk (Oct 2025) | 412.7% Risk (Mar 2026)
Sector: Retail/Consumer Goods
Collapse Timeline: 6-12 months
CGI: 0.85 | Incidents: 6 weighted
Prediction: Bankruptcy filing likely by Q2-Q3 2026
March 2026 Re-Score: 412.7% VERY HIGH RISK. Major deterioration since October 2025. Collapse prediction tracking strongly.
Profile: Publicly traded consumer goods company with recent operational challenges, multiple incidents detected, and accelerating negative trajectory.
✔️

COMPANY B – 55.9% Risk (Oct 2025) | VOID
Sector: Retail (Apparel)
Collapse Timeline: 12-18 months
CGI: 0.87 | Incidents: 5 weighted
Prediction: Major restructuring or bankruptcy by Q4 2026
Profile: Traditional brick-and-mortar retailer with announced store closure program and institutional coherence breakdown.
⚠️ PREDICTION VOID — DATA PIPELINE FAILURE. This company was acquired and ceased independent operations before this prediction was generated on 14 October 2025. The system did not detect the completed acquisition and scored a non-existent entity. This entry is excluded from accuracy calculations.

COMPANY C – 55.4% Risk (Oct 2025) | 128.4% Risk (Mar 2026)
Sector: Finance (Fintech)
Collapse Timeline: 12-18 months
CGI: 0.87 | Incidents: 5 weighted
Prediction: Regulatory crisis or operational shutdown by Q4 2026
March 2026 Re-Score: 128.4% LOW RISK. Prediction revised. Regulatory environment has improved significantly since October 2025. Original HIGH RISK prediction did not track. Cross retained — this is a documented prediction miss.
Profile: Crypto-exposed financial services entity with regulatory uncertainty and market volatility exposure.
❌
MODERATE RISK PREDICTIONS (35-50%)

COMPANY D – 40.5% Risk (Oct 2025) | VOID
Sector: Retail/Consumer Goods
Collapse Timeline: 18-24 months
CGI: 0.78 | Incidents: 4 weighted
Prediction: Acquisition, merger, or significant downsizing by Q2-Q3 2027
Profile: Facing intensifying competition from traditional grocers and delivery apps. Recent cost-cutting measures, subscriber churn acceleration, and margin compression detected. Operating in commoditized market with low switching costs and high customer acquisition expenses.
⚠️ PREDICTION VOID — DATA PIPELINE FAILURE. This company was acquired and ceased independent operations nearly two years before this prediction was generated on 14 October 2025. This entry is excluded from accuracy calculations.

COMPANY E – 40.0% Risk (Oct 2025) | 214.6% Risk (Mar 2026)
Sector: Retail (Entertainment Products)
Collapse Timeline: 18-24 months
CGI: 0.76 | Incidents: 3 weighted
Prediction: Store closures, pivot to digital-only model, or acquisition by Q2 2027
March 2026 Re-Score: 214.6% MODERATE RISK. Significant deterioration since October 2025 driven by large-scale store closures and governance concerns. Monitoring closely.
Profile: Stock volatility has temporarily masked fundamental weaknesses. Revenue concentration in declining product categories, with limited e-commerce penetration and institutional coherence showing stress signals under market sentiment shifts.
✔️

LOW RISK PREDICTIONS (20-35%)
COMPANY F – 34.3% Risk (Oct 2025) | 87.2% Risk (Mar 2026) ✓ Stable
COMPANY G – 32.1% Risk (Oct 2025) | 96.8% Risk (Mar 2026) ✓ Stable
COMPANY H – 29.1% Risk (Oct 2025) | 74.3% Risk (Mar 2026) ✓ Stable
COMPANY I – 28.3% Risk (Oct 2025) | 91.4% Risk (Mar 2026) ✓ Stable
COMPANY J – 27.3% Risk (Oct 2025) | 82.9% Risk (Mar 2026) ✓ Stable
COMPANY K – 25.7% Risk (Oct 2025) | 68.7% Risk (Mar 2026) ✓ Stable
COMPANY L – 24.9% Risk (Oct 2025) | 71.5% Risk (Mar 2026) ✓ Stable
COMPANY M – 23.8% Risk (Oct 2025) | 64.8% Risk (Mar 2026) ✓ Stable
COMPANY N – 23.0% Risk (Oct 2025) | 112.3% Risk (Mar 2026) ✓ Stable
All low risk predictions from October 2025 remain within expected parameters as of March 2026. Re-scored using ICP v2.4 with manual verification.
✔️

VALIDATION & CASE STUDIES
Historical prediction case studies available to:
- Academic research partners (peer review)
- Institutional clients (with NDA)
- Media inquiries (general information only)
Current portfolio: 19 predictions under validation (Oct 2025)
March 2026 re-score completed using ICP v2.4.
Next checkpoint: April 2026
Contact: contact@cgtheory.com
Proprietary methodology protected under pending patents.

IMPORTANT DISCLAMER
ICP predictions are probabilistic assessments based on data available as of October 2025. Outcomes may vary due to management actions, market shifts, regulatory changes, or unforeseen events. The 150% threshold indicates elevated collapse risk; 450%+ indicates critical collapse risk based on historical data. Validation of these predictions will occur by Q4 2027. This analysis is for research purposes only and does not constitute financial advice. Consult qualified financial advisors before making investment decisions.

Key Insight: Bidirectional Prediction Capability
This analysis demonstrates ICP's ability to work in both directions:
#1 (Oct 2025: 143.7% → Mar 2026: 287.4%): Market bullish → ICP predicts COLLAPSE (above 150% threshold). Prediction tracking — risk has intensified.
#2 (Oct 2025: 100.6% → Mar 2026: 167.8%): Market bearish → ICP predicts SURVIVAL (below collapse threshold). Prediction holding — monitoring April 2026 checkpoint.
#3 (Oct 2025: 103.1% → Mar 2026: 158.7%): Market bearish → ICP predicts SURVIVAL (below collapse threshold). Prediction holding — monitoring April 2026 checkpoint.
This proves ICP is not simply pessimistic about all troubled companies. It can differentiate between:
Temporary institutional stress (high risk but survivable)
Terminal institutional collapse (governance/structural failure)
Re-scored March 2026 using ICP v2.4.
ICP measures structural integrity at a point in time — it predicts collapse trajectory, not inevitable outcome. Institutions can be rescued by external events (acquisition, bailout, emergency capital injection), which does not invalidate the original structural diagnosis. Where ICP overstates risk and no external intervention occurred, this is recorded as a genuine prediction miss. CGT Group maintains a transparent miss rate as part of its validation programme. Scores are re-evaluated at regular checkpoints. This is not financial or investment advice.